Inventory Forecasting Software: Test the Forecast Before You Buy
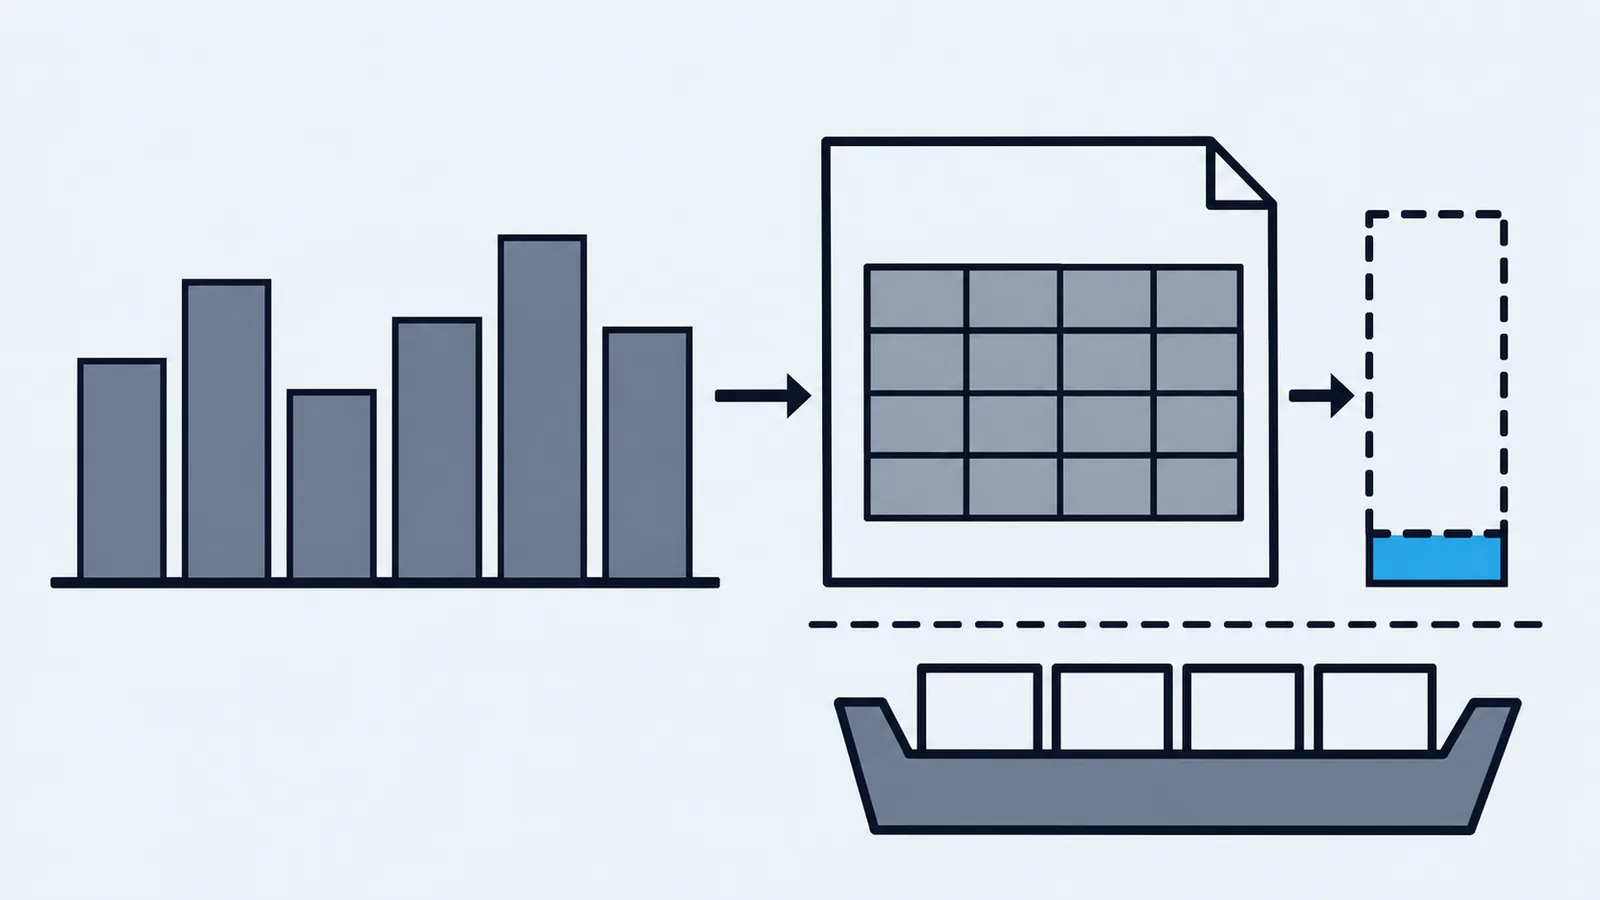
A forecast of 105 units next week is useful only if you know how it was calculated, how wrong similar forecasts have been and which warehouse needs the stock. Inventory forecasting software should answer those questions before suggesting a purchase order.
Start with a baseline you can reproduce. Compare a candidate product against that baseline on a period it has not seen. A more complicated model earns its place by improving a purchasing decision, not by putting a smoother line on a chart.
Forecasting, tracking and replenishment
Inventory tracking records what happened: receipts, orders, transfers, adjustments and the quantities that remain. Forecasting estimates future demand. Replenishment combines that estimate with lead time, current stock, incoming supply and a chosen buffer to decide what to buy.
A reorder threshold can work without an automatically trained forecast. A buyer can calculate demand during lead time and enter a threshold manually. That is useful stock control, but it does not mean the system learns seasonal patterns or predicts the next promotion.
| Input or decision | What to inspect |
|---|---|
| Historical demand | Units requested or sold by product, date and location |
| Availability history | Periods when the product could not be sold |
| Supplier lead time | Actual time from ordering to usable receipt |
| Forecast | Quantity, period, method and any manual override |
| Error measurement | Predictions preserved before actual demand was known |
| Purchase recommendation | Stock, incoming supply, buffer and ordering constraints |
A product can perform several roles, but the quantities should remain distinct. A forecast is not stock on hand, and a purchase recommendation is not a confirmed supplier delivery.
Build a moving-average baseline
Consider hypothetical weekly demand of 80, 100, 90, 110, 120 and 100 units. Assume complete seven-day periods for one product at one warehouse, with no stockouts, promotions or returns to adjust.
A four-week moving average for the next week uses the most recent four observations:
Next-week forecast = (90 + 110 + 120 + 100) / 4
                   = 420 / 4
                   = 105 units
The calculation is reproducible in Python:
weekly_demand = [80, 100, 90, 110, 120, 100]
next_week = sum(weekly_demand[-4:]) / 4
print(next_week)  # 105.0
This baseline assumes recent weeks are relevant to the next one. It reacts slowly to a lasting increase and can miss annual seasonality. Those weaknesses give a more capable forecasting product something concrete to improve.
Do not average warehouses together just because the product identifier matches. One location may have daily sales while another serves occasional wholesale orders. A network-level total can conceal a local shortage.
Test predictions against unseen demand
Use the first four weeks to predict week five. The forecast is (80 + 100 + 90 + 110) / 4 = 95. Actual demand is 120, so the absolute error is 25 units.
Move the window forward. Weeks two through five predict week six: (100 + 90 + 110 + 120) / 4 = 105. Actual demand is 100, so the absolute error is 5 units.
Mean absolute error = (25 + 5) / 2 = 15 units per forecast
Absolute error as share of actual demand = 30 / (120 + 100)
                                         = 13.64%
Two test periods are too few to establish dependable performance; this small example exposes the calculation. For a real evaluation, preserve many historical prediction dates and include the difficult periods the business encounters.
Measure error by the decisions it changes. Missing demand on an expensive, long-lead-time item can matter more than a similar percentage error on a cheap item delivered tomorrow. Keep unit errors alongside percentage scores so low-volume products do not disappear inside an average.
Also preserve the forecast that existed before each purchasing decision. Recalculating an old forecast with newer observations makes the model look better while telling you little about what the buyer could have known at the time.
Sales history can hide lost demand
Zero sales can mean nobody wanted the product. It can also mean the shelf was empty. Training on those situations as if they were identical teaches the model to order too little after a stockout.
Preserve availability dates and annotate promotions, closures, large one-off orders and product replacements. Keep original observations and adjustments separately. A buyer should see whether a recommendation changed because of new demand or because somebody corrected the history.
Returns need a consistent rule too. Gross orders, shipped units and net sales can produce different demand series. Pick the definition appropriate to the purchasing decision and apply it consistently across training and test periods.
New products need assumptions. A predecessor's demand may be a useful starting point, but document the substitution and review it as real observations arrive. An empty history is not evidence that future demand will be zero.
Turn the forecast into an order
Continue the hypothetical example with 105 units a week, or 105 / 7 = 15 units a calendar day. Supplier lead time is ten days and the buyer chooses a thirty-unit buffer.
Lead-time demand = 15 × 10              = 150 units
Reorder threshold = 150 + 30            = 180 units
Suppose there are sixty units on hand and eighty confirmed incoming, with no other commitments or holds in this example. Inventory position is 60 + 80 = 140, below the threshold.
For twenty-one days of coverage plus the same buffer, the target position is 15 × 21 + 30 = 345. The proposed order is 345 - 140 = 205 units before minimum-order quantities, pack sizes or budget constraints.
These are planning calculations, not Inventoros-generated recommendations. The reorder point formula explains the timing decision, and the safety stock formula covers choosing a buffer. A fixed thirty-unit example does not establish a particular service level.
Check incoming supply dates before subtracting every open purchase order. Eighty units arriving after the expected shortage do not protect the next ten days. Keep the time horizon consistent with the decision.
Where Inventoros supplies data
Inventoros records products, stock, orders, purchase receipts, transfers and adjustments, with reporting and REST/MCP access to data. It has no built-in demand forecasting feature and no safety-stock field. Calculate the forecast and buffer in a separate planning process, then review the stock-control decisions.
Reorder points are available per product and per warehouse. Keep their scope aligned with the demand series. A threshold calculated for the whole business should not be copied to every warehouse as though each has that demand independently.
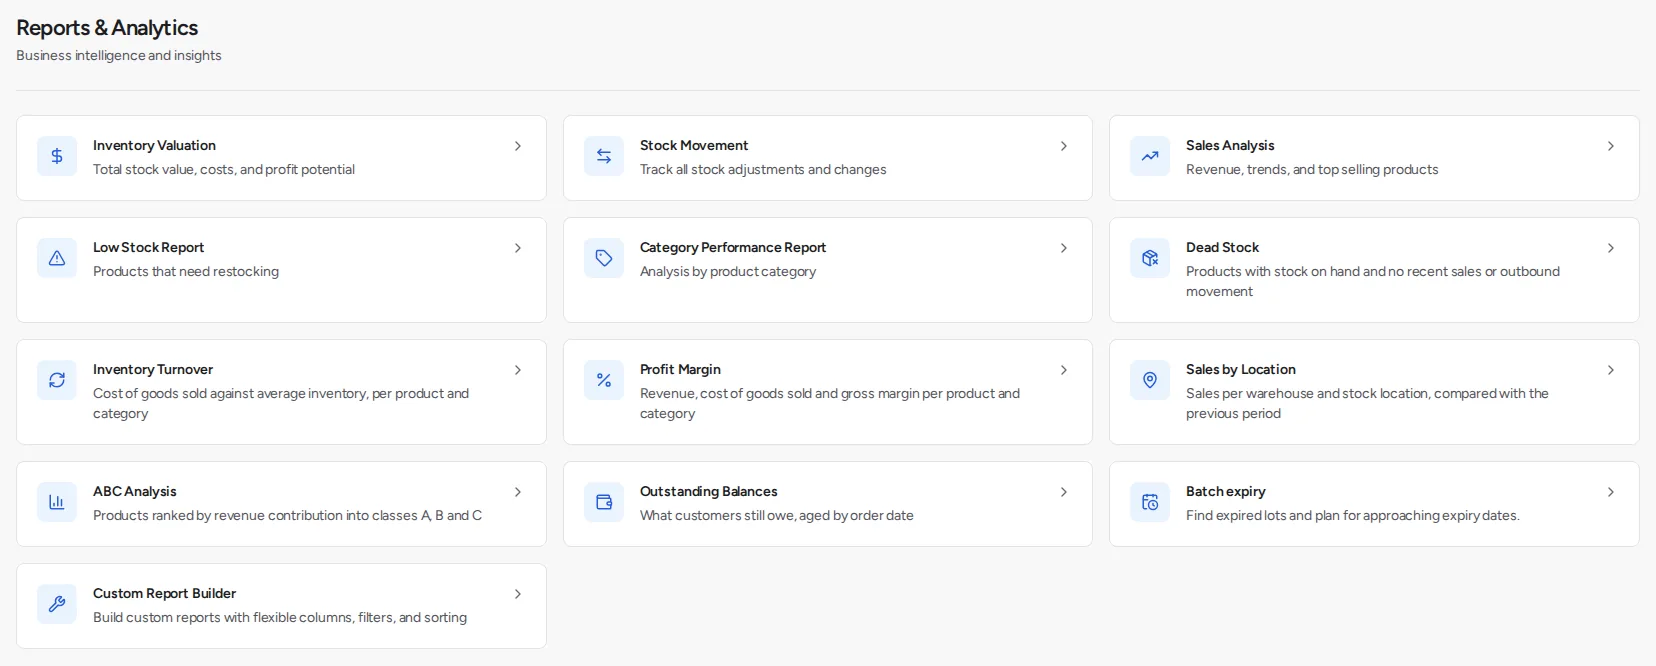
The Reports screen groups Inventory Valuation, Stock Movement, Low Stock and other reports. These provide views of recorded inventory and activity rather than predictions of future sales.
A read-only product snapshot can be retrieved through REST:
curl --get "$INVENTOROS_URL/api/v1/products" \
  --header "Authorization: Bearer $INVENTOROS_TOKEN" \
  --header "Accept: application/json" \
  --data-urlencode "per_page=100" \
  --data-urlencode "page=1"
Use a token with the required product-reading permission and follow pagination. This request returns current product data; it does not turn a snapshot into a demand history. Obtain relevant dated order and movement records for the planning dataset and reconcile totals before training a model. The API documentation describes permissions and endpoints. GraphQL covers a subset of the REST surface.
Evaluate dedicated planning software
Netstock describes forecasting with seasonality and overrides. Inventory Planner places forecasts alongside replenishment and buying decisions. StockTrim focuses on inventory planning. Inspect those workflows rather than assuming a particular model will outperform your baseline.
Give candidates the same historical cutoff and product set. Include intermittent sellers, a fast mover and a product affected by a stockout. Ask to see how the recommendation changes when lead time doubles or a promotion is removed from the history.
I would buy dedicated forecasting software when better purchasing decisions and reduced manual planning justify its operating and subscription cost. Do not choose Inventoros alone when automated forecasting is a purchase requirement. It can supply inventory data while a separate planning tool handles that task.
Budget for the complete workflow
Include data cleanup, integration maintenance, planner review and exception handling. A hypothetical $300 monthly planning subscription costs $3,600 a year. Saving five planner hours a month at $50 an hour recovers 5 × 50 × 12 = $3,000, leaving $600 to justify through other benefits before setup costs.
Do not count an avoided stockout as recovered revenue without a defensible demand and margin estimate. Track actual changes during the pilot: purchasing effort, excess stock, stockout days and forecast error. A small, stable catalogue may be better served by a spreadsheet baseline.
Keep a person responsible for overrides. A forecast can be statistically reasonable while ignoring a supplier closure or an announced product retirement. Record why the buyer changed a recommendation so the team can distinguish judgment from a data mistake later.
Questions before choosing
How much history is enough?
Enough to represent the patterns you want to predict and reserve a meaningful test period. A few weeks cannot establish annual seasonality. New products need explicit assumptions rather than invented precision.
Should every product use the same model?
Not necessarily. Frequent demand and sporadic bulk orders behave differently. Evaluate groups separately and keep the simplest adequate baseline.
Does a low-stock report count as a forecast?
No. It identifies stock relative to a rule or threshold. Forecasting estimates demand over a future period; the buying process connects that estimate to replenishment.
Prices and requirements as of November 2026.